Estimating return on investment (ROI) is essential to keeping cash flow healthy. Even more so in manufacturing, a sector that needs to spend across various fronts such as raw materials, labor, logistics, and equipment. Therefore, it is necessary to have a strategic vision and validate which factory investments are paying off and which are not bringing a positive return. To do this, the ideal approach is to calculate the ROI and Payback of investments.
When it comes to technology investments, calculating gains can be challenging because many factors come into play, such as production scheduling, error reduction, time optimization, better inventory control, etc.
In this article, we will explain the differences between ROI and Payback, show how to apply the calculations for these two metrics, and demonstrate how to apply them to APS solutions. Read on to learn more!
What are the differences between ROI and Payback?
ROI and Payback are metrics used to calculate the return a company is getting on its investments. Both are used in managing various areas because they allow the manager to have a clearer view of what is working well or poorly for the company, thereby speeding up decision-making.
- ROI (Return On Investment) refers to the return on a specific investment. The function of ROI within companies is to verify whether or not it is worth investing in a particular product or service.
- Payback, on the other hand, calculates the payback period of the investment. In other words, it checks the elapsed time between the respective investment and the moment when the accumulated capital equals the amount invested. It can be said that Payback is the conversion of ROI into time.
How to calculate ROI?
Using the ROI calculation, it is possible to understand the return that a given investment is bringing to your company. This metric allows you to evaluate how certain strategies are contributing to company results.
Additionally, you can evaluate what is not working well and optimize processes based on the outcome so that they perform better. Simply put, the formula for ROI is as follows:
ROI = Revenue – Cost ÷ Cost.
In practice, we can illustrate this as follows: imagine that the amount applied to a certain investment was 10,000 reals and the gain from it was 100,000. Using the ROI formula above, we have:
ROI = (100,000 – 10,000) ÷ 10,000
ROI = 9
In this case, the Return on Investment would be 9 times the initial investment. You can also calculate the return percentage by multiplying the result by 100; that is, in this example, the return would be 900%.
If, on the other hand, the ROI is negative or low, it means the investment made is not bringing a good return. Therefore, with the ROI metric, it is always important to set goals, learn from the results, and monitor them constantly.
How to calculate Payback?
To calculate Payback, you need to base it on a specific period of time, usually months or years. In short, the formula applied is as follows:
Payback = Initial investment (cost) ÷ Period gain (revenue)
Applying this calculation to a practical example, let’s assume 10,000 reals were invested, and in one month your cash flow balance was 1,000 reals. Payback should be calculated as follows:
Payback = 10,000 ÷ 1,000
Payback = 10
This means that if the same average amount continues to enter the company’s cash flow, it will take 10 months to recover what was invested. After this period, any incoming amount will be profit.
This metric is highly advantageous because, besides being simple to calculate, it provides an idea of net profit and project risk. However, for long-term projects, this method is less advisable because it ends up not taking into account cash flows generated after the recovery time.
When calculating for an APS system, this calculation is interesting at the time of tool implementation, but for ongoing monitoring, the most suitable methodology is ROI.
Why adopt an APS solution?
Currently, the business environment is dynamic and constantly changing. Therefore, manufacturers need to be fast and make smart decisions to meet increasingly demanding customer requirements and the evolving market demands marked by growing competition.
The need for a flexible and agile system that solves production planning has become more important than ever for manufacturers. Industries that lack scenario-planning capabilities often end up making decisions that harm the company’s profits.
A company might decide to proceed with the manufacturing of a new product based on plant capacity and favorable sales forecasts. However, the company will fail to anticipate the negative impact it will have on transportation capacity, for example.
Without the ability to perform a strategic and global analysis of the entire production process, the factory becomes incapable of evaluating the total impact of a decision.
Simulating a situation taking relevant factors into account before making a decision will enable the plant to achieve greater efficiency in product delivery. Thus, it will also be possible to gain insights into process optimization.

This is because bottleneck visualization becomes clearer, making it easier to implement quick changes within planning.
What are the returns of an APS solution?
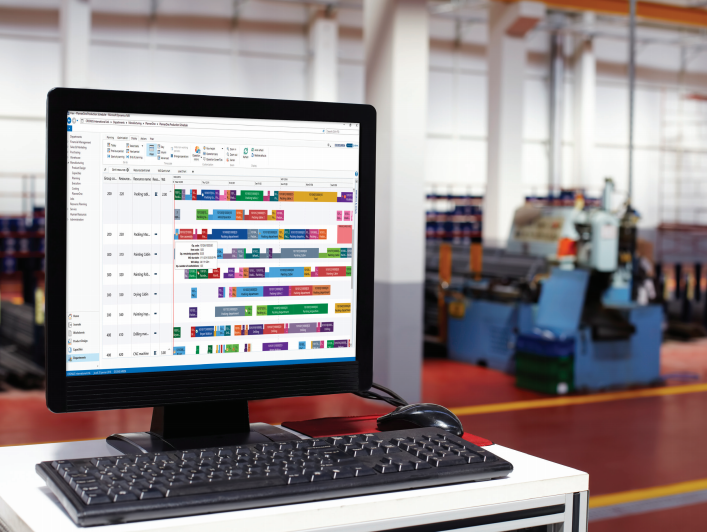
An APS (Advanced Planning and Scheduling) solution aims to optimize shop floor production sequencing. Since an industry handles a high volume of demands, projecting all production planning manually while accounting for various factors that can impact deadlines becomes impossible.
However, when production planning is done by an APS tool, various information that can impact deadline control is gathered, keeping in mind that production has finite capacity. Among the factors that can influence this are equipment maintenance and failures, stock inputs, labor shortages, and unforeseen natural events. All of this is taken into account by the tool when generating the production plan.
Additionally, APS solutions allow the user to evaluate which deliveries are most urgent. This is because it is possible to include multiple identification criteria, such as priority orders that carry higher penalties in case of delays, generate more profit, or have been waiting the longest. This acts toward reducing lead time and work-in-process (WIP) inventory.
APS systems prevent mismatched information and task disorganization, allowing teams to work simultaneously on activities that do not interfere with one another, thereby reducing idle time at the factory.
The tools help reduce idle time in two ways:
- They present an organized and clear visualization of planning, facilitating decision-making and team management.
- They reduce waiting times at machines facing demand by generating synchronization that facilitates this. Thus, the utilization time of each machine is optimized, bringing good results to the company.
They also help save on electricity during peak consumption hours by helping program production so that only critical resources run during those times.
On average, the Payback period evaluated for an APS solution like Delmia Ortems is 6 to 12 months.
Now you know in more detail what ROI and Payback are, and how to calculate these metrics in an APS solution. Tell us in the comments: did you already know the benefits of Delmia Ortems? Interested in learning more about this system? Get in touch with our specialists to find out more.
 Signed by: Aloisio Arbegaus, director at Teclógica